
I asked AI to make volume tiers
It did not do a good job
Ian Clark · May 1, 2026 · 9 min read
The BLUF (Bottom Line Up Front)
You can assess different volume tier structures with a metric called Fit which measures how likely you are to see churned revenue under a given price structure.
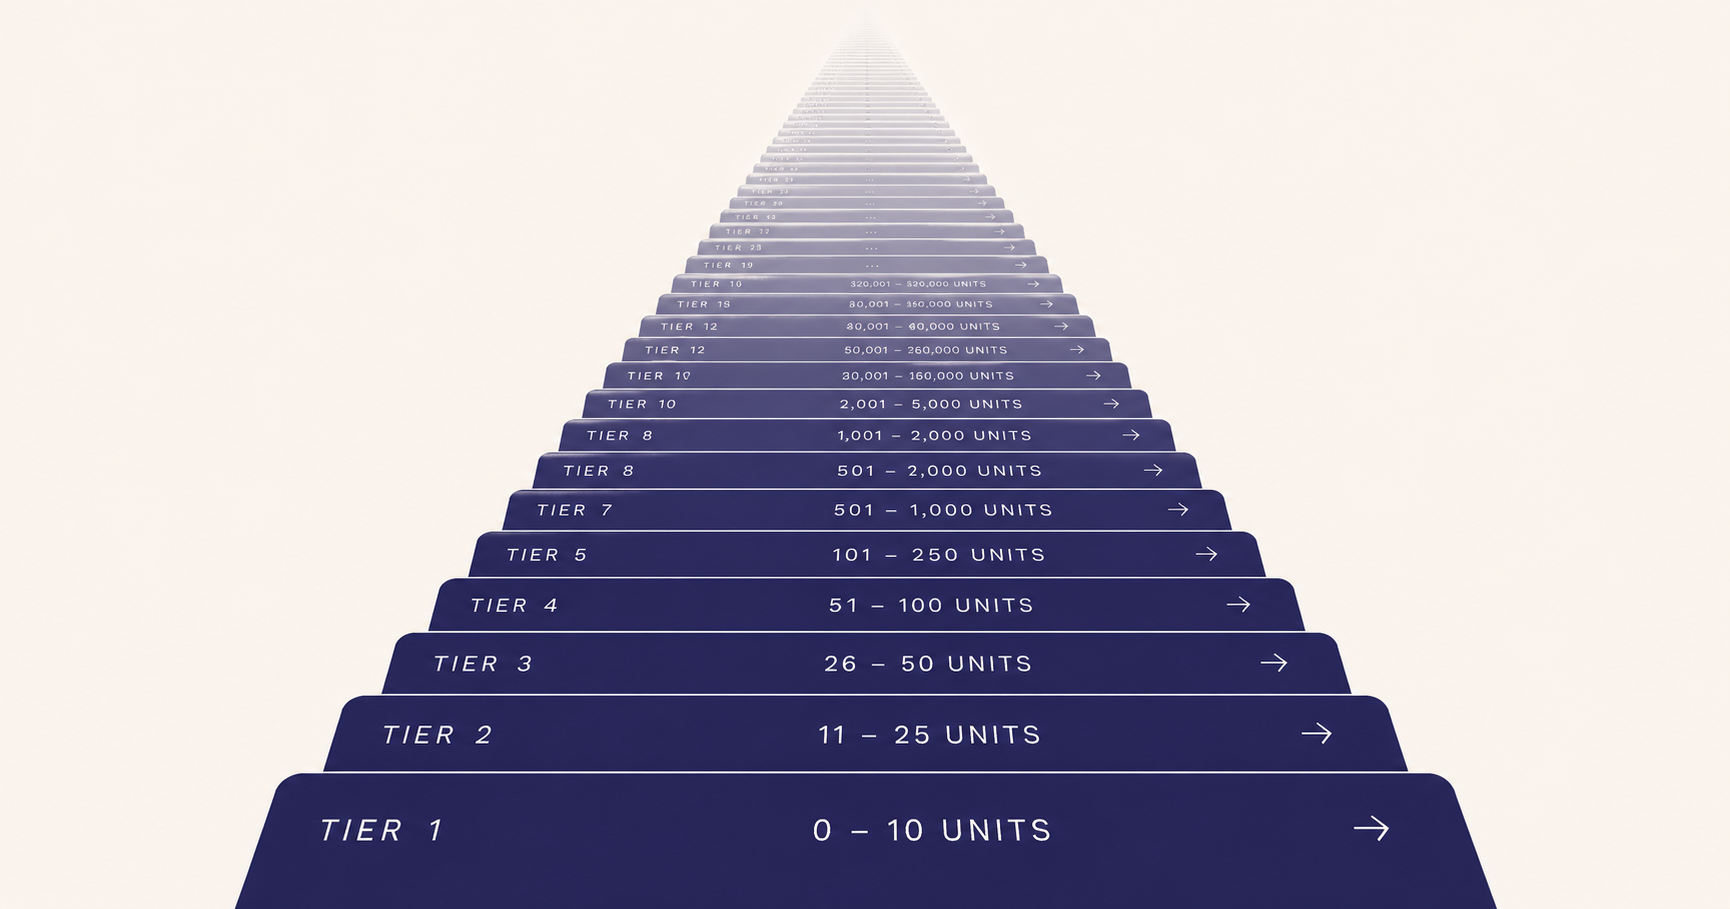
Most companies have too many volume tiers. You see most of the improvements in Fit after ~6 tiers.
There are lots of ways to find the right breakpoints for your volume tiers. Please don’t use AI.
How many volume tiers should I have?
Fewer than you think.
Let’s start off with what do I mean by “volume tiers”. Remember, volume tiers are a component of Price Structure (as distinct from Metric and Level). Structure is how the Price Metric relates to time and volume. For more posts on Price Structure, see below:
Volume tiers allow customers to get discounts when they buy more volume. This tactic is used almost universally by businesses.

3 Volume Tiers @ Costco (powered by ChatGPT)
Today we’re doing a deep dive into choosing how many volume tiers you need and where you should put them. Let’s dive in.
Infinite Tiers!
The first question we have to answer is “why should we have volume tiers at all?” Why not have a price model like the one below:
Tier | Units | Unit Price | Total Price |
|---|---|---|---|
1 | 1 | $100 | $100 |
2 | 2 | $95 | $190 |
3 | 3 | $90 | $270 |
4 | 4 | $85 | $340 |
5 | 5 | $80 | $400 |
6 | 6 | $75 | $450 |
7 | 7 | $70 | $490 |
8 | 8 | $65 | $520 |
9 | 9 | $60 | $540 |
10 | 10 | $55 | $550 |
… | … | … | … |
The first reason is that it’s complicated. What happens to my price when I go from my 13th to my 14th unit? You have to do the math.
The second reason is that it’s difficult to implement. Usually when we have volume tiers, we have some kind of subscription. A subscription means that each tier needs to have a separate SKU, managed in your billing system. Each SKU in turn needs to be managed by an under-paid RevOps person, who is just going to be mad that you built a lazy price structure.
The most important reason is that it’s unnecessary. It is highly unlikely that the unit willingness-to-pay changes as granularly as we see above - and that’s for really small numbers of “units”. Imagine we were pricing API calls and sold them in the hundreds of thousands - should we really have a different price for 153,508 and 153,509 API calls?!?
Case Studies: Zapier & Mailchimp
Let’s show 2 examples of “over tiering”. Here’s a screenshot of Zapier’s pricing today:

Zapier’s Volume Tiers (in slider)
See that slider on top? You can move that and adjust the price accordingly. Here’s how the price of “Professional” changes at each of their 18 tiers. Please note my snarky comments on their 1st tier…
Tasks | Professional Price |
|---|---|
WhY dOeS THiS TiEr ExiSt?!? —>100 | …when it’s the same price —>$19.99 |
750 | …as the next tier????? —>$19.99 |
1,500 | $39.00 |
2,000 | $49.00 |
5,000 | $89.00 |
10,000 | $129.00 |
20,000 | $189.00 |
50,000 | $289.00 |
100,000 | $489.00 |
200,000 | $769.00 |
300,000 | $1,069.00 |
400,000 | $1,269.00 |
500,000 | $1,499.00 |
750,000 | $1,999.00 |
1,000,000 | $2,199.00 |
1,500,000 | $2,999.00 |
1,750,000 | $3,199.00 |
2,000,000 | $3,389.00 |
So do they need 18 tiers? They certainly don’t need that 1st tier…
Let’s look at MailChimp. There’s a drop down that allows you to pick which tier you fall into. Again, 19 volume tiers.

MailChimp’s volume tiers (in dropdown)
Let’s model it out with some sample data
To experiment with how many volume tiers we actually needed, I built a sample model of customer usage. Customer usage tends to follow a power law distribution where most people use very little, but a few large customers have sky high usage. Also known as the 80-20 rule, power law distributions are incredibly common in both nature and finance1 .
In the example below, I have 100 customers. The top customer needs 10k “usage units” and it goes down from there.

Sample Power Law Distribution
So how many tiers do I need?
Fit - a metric for optimizing volume tiers
Let’s take 2 extremes. On one extreme, we have 100 different volume tiers, 1 for each customer. That would perfectly fit every customer’s unique needs.
On the other extreme we have only 1 volume tier (10,000). The top customer buys exactly what they need, but every other customer is over paying. How much are they overpaying?
The bottom customer needs .01 usage units, so they over-buy by 9,999.99
The middle customer needs 10 usage units, so they over-buy by 9,990
The 90th customer needs 2,512 usage units, so they over-buy by 7,488
and so on and so on. You can represent this as the sum of all over-purchases, divided by the total needed. In a 1-tiered model, that number is 922,504 / 77,497 = 11.9. Obviously in a 100-tiered model, that number is 0. We call this number model “Fit”.
Fit is important because it represents risk. Customers that are forced to buy more than they need are a churn risk. Our goal should be to minimize fit with a reasonable number of tiers (i.e. not 1 for each customer).
Fit measures how well your price structure “fits” your customers’ needs and can be calculated as:
(total amount your customers are forced to over-buy) / (the total amount they would prefer to buy).
Perfect fit is 0.
What about a 2-tiered model. Surely that’s better than a 1-tiered model!
Let’s put a volume tier half way between the top usage (10k) and the bottom (~0) at 5k.
Tier | Usage |
|---|---|
1 | 0 - 5,000 |
2 | 5,001 - 10,000 |
What’s the fit now? It turns out it’s 5.8. Wow, we got half way to “perfect” by adding a single tier. Let’s do it again!
Tier | Usage |
|---|---|
1 | 0 - 3,333 |
2 | 3,334 - 6,666 |
3 | 6,667 - 10,000 |
How’s the fit now? 3.8. Still improving, but more slowly. I repeated this process for 10 equally spaced tiers - here is the result.

I didn’t want to go all the way to 100…
What’s the takeaway? You’ve gotten the vast majority of improvements by the time you hit 6 - 7 tiers.
Optimizing your tiers
Perhaps you realized that equally spaced tiers don’t make a lot of sense. For example, 5 equally spaced tiers (fit = 2.2) would look like this:
5 Equal Tiers Model | Usage | Number of Customers |
|---|---|---|
1 | 0 - 2,000 | 88 |
2 | 2,001 - 4,000 | 5 |
3 | 4,001 - 6,000 | 3 |
4 | 6,001 - 8,000 | 2 |
5 | 8,001 - 10,000 | 2 |
That’s not nearly enough differentiation for the bottom 88 customers, and way too much for the top 7. The first 88 customers are almost certainly over-buying. Don’t believe me? Here’s what the tiers look like when overlayed on top of customer usage needs:

Wayyyyy over-purchasing at the left / bottom side of market
A better model would look like this one below. See how nobody is buying more than ~2x their needs? In the previous model, most customers were buying 1,000x their needs.

5 Tiered Model with better fit
5 Optimal Tiers Model | Usage | Number of Customers |
|---|---|---|
1 | 0 - 35 | 59 |
2 | 36 - 284 | 15 |
3 | 285 - 1,244 | 10 |
4 | 1,245 - 3,917 | 9 |
53 | 3,918 - 10,000 | 7 |
In case you’re wondering, the fit in the optimal model above is 0.6, or 75% less risky.
Methods for optimizing tiers
You may have noticed that those tiers above do not end in nice round numbers. That’s because of how I derived them and is not best practice. Best practice would be to round those off to “marketing friendly” tiers.
So how did we arrive at those exact tiers above? Math. Let me give you 4 options for how to solve this problem.
1) Advanced: Do the math (not recommended, but it’s what I did up above)
Power law distributions follow a y = axk equation, where a and k are constants. IF YOU REALLY WANT TO (and it’s not for the faint of heart), you can do the following:
Take your data in Excel and have it approximate a power law distribution trend line
Solve for k as if y was your data’s max and x was the number of tiers you want (e.g. 5)
Use that k and plug in tier 1 - 5 to find the break points
I have warned you in advance, this method involves logarithms…
2) Intermediate: Use a non-linear optimizer
Excel comes with an optimization program called Solver. It is easy to turn on and use for this kind of work.
Build a model that sorts people into pre-defined tiers. You have to choose how many tiers you want before you get started.
Have Solver optimize the tier break points with the goal of minimizing fit.
Round off the Solver solution to something that marketing will like.
3) Basic: Use percentile rule of thumb
The easiest way to set volume tiers is to rely on the follow heuristic:
The first tier should break around the median
The second tier should break around the top quartile
The third tier should break around the top decile
The fourth tier should break around the top 5%
The last tier should break around the top percentile
For our sample data above, the model’s Fit using our heuristic was 0.51; the optimal fit (using hard math) was 0.50 - barely any improvement and way less headache inducing!
4) Stupid: Use ChatGPT
Actually, don’t use ChatGPT. Here’s why. I put in the customer data above. First it told me I needed 10 tiers, which we already covered is probably not necessary. Then it told me I could do 6 tiers if I wanted to, and called that the “sweet spot of SaaS pricing”. That part is actually right if you’ve been paying attention. Here’s what it recommended to me:
Tier | ChatGPT Recommended | Optimal |
|---|---|---|
1 | 1–5 | 1-10 |
2 | 6–20 | 11-325 |
3 | 21–75 | 326-2,500 |
4 | 76–250 | 2,501-5,000 |
5 | 251–1,000 | 5,000-8,750 |
6 | 1,000+ | 8,750+ |
And here’s the kicker - ChatGPT’s model had a fit of 1.4, almost 3x as risky as our heuristic.
Don’t believe everything you hear from AI folks!

Actual photo of ChatGPT struggling with pricing
Get in touch
Crescendo works with medium-sized software companies to improve their pricing, packaging, and promotion strategies. If you’d like to book a quick consult, reach out at info@crescendo.partners or schedule time via the button below.